Pricing Diamonds with the 4 C’s
Contents
Pricing Diamonds with the 4 C’s
By: Kyle W. Brown
Problem Statement
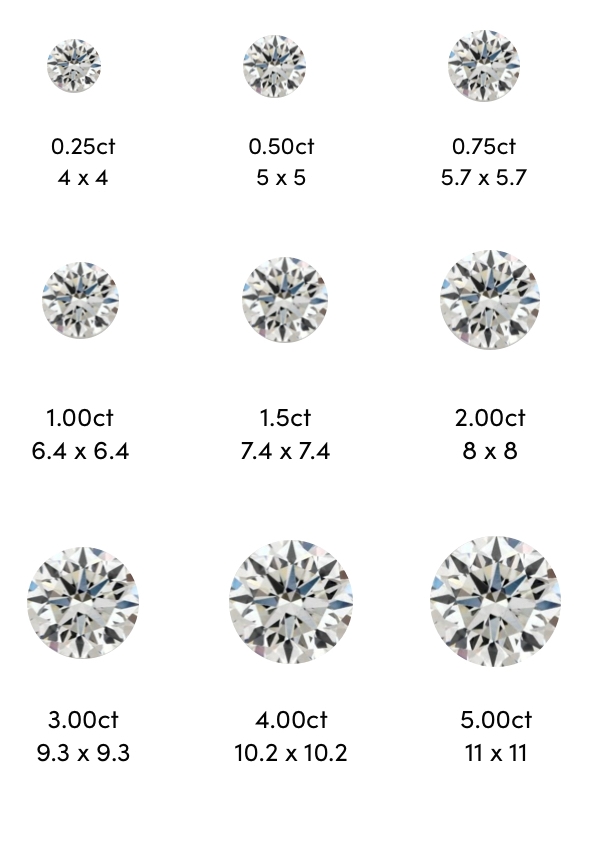
Pricing diamonds is notoriously difficult, especially for brokers. A diamond can be the same size and same weight but priced thousands of dollars differently. This poses significant challenges to setting the fair market value of diamonds.

Value Proposition
Give diamond brokers insights into how diamonds are priced. The objective is to provide a tool such as a dashboard that will give greater understanding of how diamonds may be priced.
Problems
The problems faced during this analysis include:
Determining the relationship to the 4 C’s and pricing, or any identifiable patterns?
How are the 4 C’s distributed across the data?
How to address the
cut,color, andclaritycategorical variables?How accurate can the price of diamonds be predicted?
Solutions
There appears to be an inverse pricing pattern with the pricing of diamonds with the 4 C’s. When comparing the relationship of best
colorwith the bestclaritydiamonds, we see that the averageprice($8,307) significantly higher to the rest of the pivot table.There is correlations among the features, and as a whole the data demostrates not normal distributions.
Addressed the
cut,color, andclaritycategorical variables with ordinal encoding of 1-5 (cut), 1-7 (color), and 1-8 (clarity) from best to worst across the variables.Based on the best performing model,
pricecan be predicted quite accurately with a 99% predicted performance.
Suggestable patterns include:
The inverse pricing pattern is first observed with the average
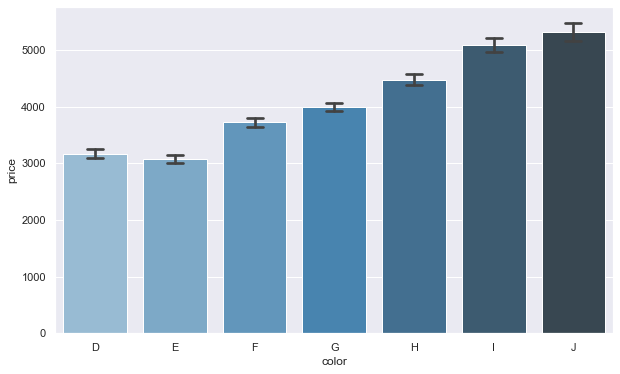
priceof diamonds bycolorgoing from lowest to highest, similarities withcutandclaritycontinue as well.The inverse pricing is due the
caratsize increase from best to worst diamonds acrosscut,color, andclarity.The worst
cut,color, andclaritydiamonds have the highest prices.The best
cut,color, andclaritydiamonds are among the smallestcaratin the dataset.
import pandas as pd
import matplotlib.pyplot as plt
import numpy as np
import seaborn as sns
sns.set()
diamonds = "https://raw.githubusercontent.com/kyle-w-brown/diamonds-prediction/main/data/diamonds.csv"
df_diamonds = pd.read_csv(diamonds)
df_diamonds.head()
| carat | cut | color | clarity | depth | table | price | x | y | z | |
|---|---|---|---|---|---|---|---|---|---|---|
| 0 | 0.23 | Ideal | E | SI2 | 61.5 | 55.0 | 326 | 3.95 | 3.98 | 2.43 |
| 1 | 0.21 | Premium | E | SI1 | 59.8 | 61.0 | 326 | 3.89 | 3.84 | 2.31 |
| 2 | 0.23 | Good | E | VS1 | 56.9 | 65.0 | 327 | 4.05 | 4.07 | 2.31 |
| 3 | 0.29 | Premium | I | VS2 | 62.4 | 58.0 | 334 | 4.20 | 4.23 | 2.63 |
| 4 | 0.31 | Good | J | SI2 | 63.3 | 58.0 | 335 | 4.34 | 4.35 | 2.75 |
df_diamonds.shape
(53940, 10)
Almost 54,000 rows in the dataset.
df_diamonds.info()
<class 'pandas.core.frame.DataFrame'>
RangeIndex: 53940 entries, 0 to 53939
Data columns (total 10 columns):
# Column Non-Null Count Dtype
--- ------ -------------- -----
0 carat 53940 non-null float64
1 cut 53940 non-null object
2 color 53940 non-null object
3 clarity 53940 non-null object
4 depth 53940 non-null float64
5 table 53940 non-null float64
6 price 53940 non-null int64
7 x 53940 non-null float64
8 y 53940 non-null float64
9 z 53940 non-null float64
dtypes: float64(6), int64(1), object(3)
memory usage: 4.1+ MB
Consolidating x, y, and z into volume.
df_diamonds['volume'] = round(df_diamonds['x'] * df_diamonds['y'] * df_diamonds['z'], 2)
df_diamonds.head()
| carat | cut | color | clarity | depth | table | price | x | y | z | volume | |
|---|---|---|---|---|---|---|---|---|---|---|---|
| 0 | 0.23 | Ideal | E | SI2 | 61.5 | 55.0 | 326 | 3.95 | 3.98 | 2.43 | 38.20 |
| 1 | 0.21 | Premium | E | SI1 | 59.8 | 61.0 | 326 | 3.89 | 3.84 | 2.31 | 34.51 |
| 2 | 0.23 | Good | E | VS1 | 56.9 | 65.0 | 327 | 4.05 | 4.07 | 2.31 | 38.08 |
| 3 | 0.29 | Premium | I | VS2 | 62.4 | 58.0 | 334 | 4.20 | 4.23 | 2.63 | 46.72 |
| 4 | 0.31 | Good | J | SI2 | 63.3 | 58.0 | 335 | 4.34 | 4.35 | 2.75 | 51.92 |
Data Cleansing
df_diamonds[['x','y','z','volume']] = df_diamonds[['x','y','z','volume']].replace(0, np.NaN)
df_diamonds.isnull().sum()
carat 0
cut 0
color 0
clarity 0
depth 0
table 0
price 0
x 8
y 7
z 20
volume 20
dtype: int64
Removing missing data
df_diamonds.dropna(inplace=True)
df_diamonds.isnull().sum()
carat 0
cut 0
color 0
clarity 0
depth 0
table 0
price 0
x 0
y 0
z 0
volume 0
dtype: int64
Outliers
Removing the outliers
df_diamonds = df_diamonds[(df_diamonds["carat"] <= 5)]
df_diamonds = df_diamonds[(df_diamonds["depth"] < 75) & (df_diamonds["depth"] > 45)]
df_diamonds = df_diamonds[(df_diamonds["table"] < 75) & (df_diamonds["table"] > 45)]
df_diamonds = df_diamonds[(df_diamonds["x"] < 30) & (df_diamonds["x"] > 2)]
df_diamonds = df_diamonds[(df_diamonds["y"] < 30) & (df_diamonds["y"] > 2)]
df_diamonds = df_diamonds[(df_diamonds["z"] < 30) & (df_diamonds["z"] > 2)]
df_diamonds = df_diamonds[(df_diamonds["volume"] < 3500)]
df_diamonds.shape
(53902, 11)
Exploration
df = df_diamonds.describe()
heading_properties = [('font-size', '11px')]
cell_properties = [('font-size', '11px')]
dfstyle = [dict(selector="th", props=heading_properties),\
dict(selector="td", props=cell_properties)]
df.style.set_table_styles(dfstyle)
| carat | depth | table | price | x | y | z | volume | |
|---|---|---|---|---|---|---|---|---|
| count | 53902.000000 | 53902.000000 | 53902.000000 | 53902.000000 | 53902.000000 | 53902.000000 | 53902.000000 | 53902.000000 |
| mean | 0.797555 | 61.749434 | 57.455694 | 3930.426793 | 5.731398 | 5.733239 | 3.539387 | 129.790389 |
| std | 0.473433 | 1.419670 | 2.221249 | 3986.883678 | 1.119202 | 1.111083 | 0.691292 | 76.399565 |
| min | 0.200000 | 50.800000 | 49.000000 | 326.000000 | 3.730000 | 3.680000 | 2.060000 | 31.710000 |
| 25% | 0.400000 | 61.000000 | 56.000000 | 949.000000 | 4.710000 | 4.720000 | 2.910000 | 65.190000 |
| 50% | 0.700000 | 61.800000 | 57.000000 | 2401.000000 | 5.700000 | 5.710000 | 3.530000 | 114.840000 |
| 75% | 1.040000 | 62.500000 | 59.000000 | 5322.000000 | 6.540000 | 6.540000 | 4.040000 | 170.840000 |
| max | 4.500000 | 73.600000 | 73.000000 | 18823.000000 | 10.230000 | 10.160000 | 6.720000 | 698.460000 |
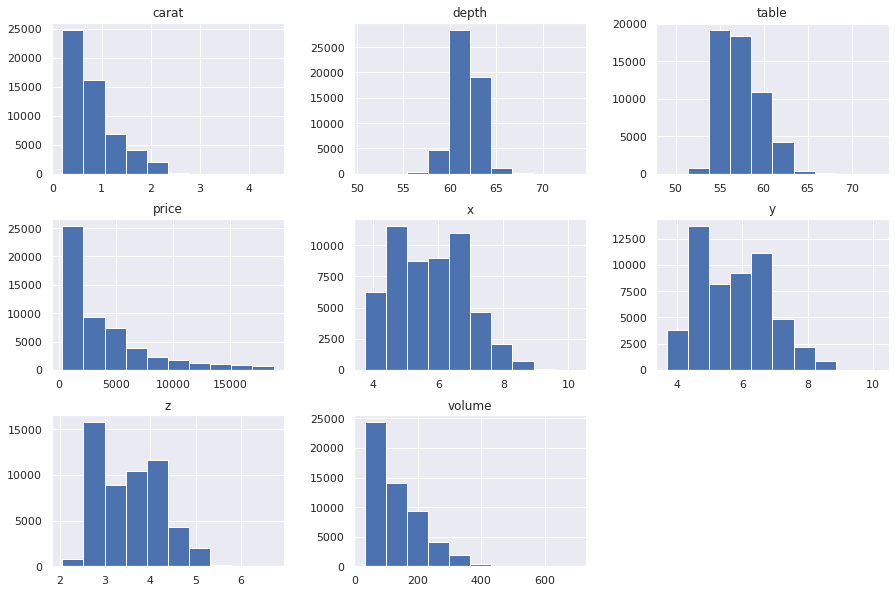
Looking at the data we see that the average carat size is 0.8 and the largest carat is 4.5. The average price per diamond is almost $4,000, while the most expensive diamond is priced at $18,823.
Exploring the Categorical Variables
df_diamonds['cut'].unique()
array(['Ideal', 'Premium', 'Good', 'Very Good', 'Fair'], dtype=object)
df_diamonds['clarity'].unique()
array(['SI2', 'SI1', 'VS1', 'VS2', 'VVS2', 'VVS1', 'I1', 'IF'],
dtype=object)
df_diamonds['color'].unique()
array(['E', 'I', 'J', 'H', 'F', 'G', 'D'], dtype=object)
df_diamonds.describe(include=object)
| cut | color | clarity | |
|---|---|---|---|
| count | 53902 | 53902 | 53902 |
| unique | 5 | 7 | 8 |
| top | Ideal | G | SI1 |
| freq | 21542 | 11281 | 13058 |
Counting the values per unique feature
df_diamonds['cut'].value_counts()
Ideal 21542
Premium 13779
Very Good 12079
Good 4902
Fair 1600
Name: cut, dtype: int64
According to this printout, the total number of diamonds decrease from best (Ideal) to worst (Fair).
df_diamonds['color'].value_counts()
G 11281
E 9791
F 9535
H 8296
D 6774
I 5419
J 2806
Name: color, dtype: int64
df_diamonds['clarity'].value_counts()
SI1 13058
VS2 12250
SI2 9183
VS1 8165
VVS2 5066
VVS1 3654
IF 1790
I1 736
Name: clarity, dtype: int64
Reordering cut, color, and clarity categorical variables from best to worst
df_diamonds['cut'] = pd.Categorical(df_diamonds['cut'], ["Ideal", "Premium", "Very Good", "Good", "Fair"])
df_diamonds = df_diamonds.sort_values('cut')
df_diamonds['color'] = pd.Categorical(df_diamonds['color'], ["D", "E", "F", "G", "H", "I", "J"])
df_diamonds = df_diamonds.sort_values('color')
df_diamonds['clarity'] = pd.Categorical(df_diamonds['clarity'], ["IF", "VVS1", "VVS2", "VS1", "VS2", "SI1", "SI2", "I1"])
df_diamonds = df_diamonds.sort_values('clarity')
Average price for cut, color, and clarity
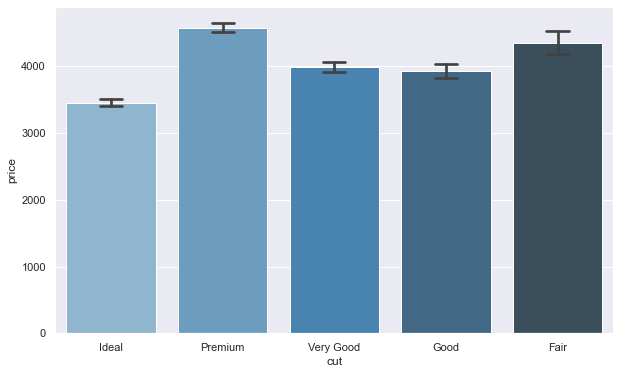
cut_avg = round(df_diamonds.groupby('cut')['price'].mean().reset_index(), 2)
cut_avg
| cut | price | |
|---|---|---|
| 0 | Ideal | 3456.21 |
| 1 | Premium | 4579.13 |
| 2 | Very Good | 3982.12 |
| 3 | Good | 3926.40 |
| 4 | Fair | 4350.67 |
The best cut (Ideal) diamonds have the lowest average price.
color_avg = round(df_diamonds.groupby('color', as_index=False)['price'].mean(), 2)
color_avg
| color | price | |
|---|---|---|
| 0 | D | 3168.11 |
| 1 | E | 3077.52 |
| 2 | F | 3723.99 |
| 3 | G | 3997.05 |
| 4 | H | 4479.38 |
| 5 | I | 5089.27 |
| 6 | J | 5319.49 |
The worst color (J) diamonds have the highest average price.
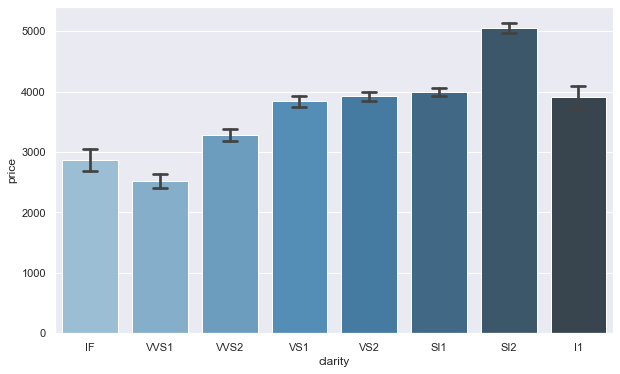
clarity_avg = round(df_diamonds.groupby('clarity', as_index=False)['price'].mean(), 2)
clarity_avg
| clarity | price | |
|---|---|---|
| 0 | IF | 2864.84 |
| 1 | VVS1 | 2519.51 |
| 2 | VVS2 | 3283.74 |
| 3 | VS1 | 3839.14 |
| 4 | VS2 | 3923.01 |
| 5 | SI1 | 3993.02 |
| 6 | SI2 | 5059.96 |
| 7 | I1 | 3910.66 |
Comparing the 4’C’s with Pivot Tables
Comparing cut, color, and clarity variables with price and carat in pivot tables.
Tables of Cut and Clarity
cut_clarity = df_diamonds.pivot_table('price', index='cut', columns='clarity')
heading_properties = [('font-size', '11px')]
cell_properties = [('font-size', '11px')]
dfstyle = [dict(selector="th", props=heading_properties),\
dict(selector="td", props=cell_properties)]
cut_clarity.style.set_table_styles(dfstyle)
| clarity | IF | VVS1 | VVS2 | VS1 | VS2 | SI1 | SI2 | I1 |
|---|---|---|---|---|---|---|---|---|
| cut | ||||||||
| Ideal | 2272.913366 | 2468.129458 | 3250.290100 | 3487.972393 | 3281.928374 | 3750.394860 | 4755.876396 | 4335.726027 |
| Premium | 3856.143478 | 2810.304065 | 3795.122989 | 4485.462041 | 4546.261919 | 4448.621886 | 5539.047910 | 3958.881773 |
| Very Good | 4396.216418 | 2459.441065 | 3037.765182 | 3808.267343 | 4215.403089 | 3932.391049 | 4988.688095 | 4078.226190 |
| Good | 4098.323944 | 2254.774194 | 3079.108392 | 3801.445988 | 4262.236196 | 3689.533333 | 4571.627087 | 3584.694737 |
| Fair | 1912.333333 | 3871.352941 | 3349.768116 | 4152.029586 | 4187.647287 | 4191.592593 | 5180.094624 | 3646.451923 |
We see that the best cut (Ideal) and the best color (IF) diamonds are priced at the third lowest across the entire table.
cut_clarity_ct = df_diamonds.pivot_table('carat', index='cut', columns='clarity')
heading_properties = [('font-size', '13px')]
cell_properties = [('font-size', '13px')]
dfstyle = [dict(selector="th", props=heading_properties),\
dict(selector="td", props=cell_properties)]
cut_clarity_ct.style.set_table_styles(dfstyle)
| clarity | IF | VVS1 | VVS2 | VS1 | VS2 | SI1 | SI2 | I1 |
|---|---|---|---|---|---|---|---|---|
| cut | ||||||||
| Ideal | 0.455041 | 0.495960 | 0.586213 | 0.674453 | 0.670213 | 0.801575 | 1.007901 | 1.222671 |
| Premium | 0.603478 | 0.533740 | 0.654724 | 0.793308 | 0.833421 | 0.907865 | 1.143252 | 1.289212 |
| Very Good | 0.618769 | 0.494588 | 0.566389 | 0.733683 | 0.811108 | 0.845978 | 1.064338 | 1.281905 |
| Good | 0.616338 | 0.502312 | 0.614930 | 0.757685 | 0.850787 | 0.830397 | 1.034193 | 1.199895 |
| Fair | 0.474444 | 0.664706 | 0.691594 | 0.878284 | 0.887791 | 0.962395 | 1.204688 | 1.345048 |
This table indicates that carat’s are increasing from the best clarity to the worst clarity diamonds. What’s interesting is we see this pattern across all cut diamonds.
Tables of cut and color
cut_color = df_diamonds.pivot_table('price', index='cut', columns='color')
heading_properties = [('font-size', '12px')]
cell_properties = [('font-size', '12px')]
dfstyle = [dict(selector="th", props=heading_properties),\
dict(selector="td", props=cell_properties)]
cut_color.style.set_table_styles(dfstyle)
| color | D | E | F | G | H | I | J |
|---|---|---|---|---|---|---|---|
| cut | |||||||
| Ideal | 2629.094566 | 2597.684008 | 3373.863755 | 3718.469070 | 3887.452152 | 4449.548541 | 4918.343017 |
| Premium | 3623.767790 | 3538.914420 | 4325.099571 | 4502.207806 | 5195.375531 | 5939.557814 | 6294.591584 |
| Very Good | 3470.467284 | 3216.314012 | 3778.820240 | 3872.753806 | 4535.059243 | 5255.879568 | 5103.513274 |
| Good | 3405.382175 | 3423.644159 | 3498.761852 | 4105.907940 | 4276.254986 | 5078.532567 | 4574.172638 |
| Fair | 4291.061350 | 3703.248869 | 3801.087097 | 4241.022581 | 5135.683168 | 4685.445714 | 4865.127119 |
An inverse pricing pattern is emerging with the best cut and best color diamonds being priced the lowest. As we see there is an increase in price almost among all the features going from best to worst (one would expect to see the opposite).
df_diamonds.pivot_table('carat', index='cut', columns='color')
| color | D | E | F | G | H | I | J |
|---|---|---|---|---|---|---|---|
| cut | |||||||
| Ideal | 0.565766 | 0.578419 | 0.655612 | 0.700447 | 0.799329 | 0.912673 | 1.063564 |
| Premium | 0.721248 | 0.717745 | 0.826957 | 0.841250 | 1.014087 | 1.144163 | 1.293094 |
| Very Good | 0.696424 | 0.676547 | 0.740961 | 0.766799 | 0.915902 | 1.046952 | 1.133215 |
| Good | 0.744517 | 0.745134 | 0.776075 | 0.847906 | 0.914729 | 1.057222 | 1.099544 |
| Fair | 0.920123 | 0.859050 | 0.901452 | 1.024355 | 1.219175 | 1.198057 | 1.310085 |
As we see that with the best cut (Ideal) and the best color (D) diamonds have an average price lower than the worst cut diamonds. This is due to the best cut and color diamonds are around a half (0.5) carat, while the worst cut (Fair) and the worst color (J) diamonds have the highest average carat at 1.31.
Tables of color and clarity
color_clarity = df_diamonds.pivot_table('price', index='color', columns='clarity')
heading_properties = [('font-size', '11px')]
cell_properties = [('font-size', '11px')]
dfstyle = [dict(selector="th", props=heading_properties),\
dict(selector="td", props=cell_properties)]
color_clarity.style.set_table_styles(dfstyle)
| clarity | IF | VVS1 | VVS2 | VS1 | VS2 | SI1 | SI2 | I1 |
|---|---|---|---|---|---|---|---|---|
| color | ||||||||
| D | 8307.369863 | 2897.163347 | 3351.128391 | 3030.158865 | 2587.225692 | 2976.146423 | 3931.101460 | 3863.023810 |
| E | 3668.506329 | 2219.820122 | 2499.674067 | 2859.463224 | 2751.081037 | 3161.838005 | 4173.826036 | 3510.465347 |
| F | 2750.836364 | 2804.276567 | 3475.512821 | 3796.717742 | 3756.795093 | 3708.651480 | 4476.996259 | 3342.181818 |
| G | 2558.033774 | 2866.820821 | 3845.283437 | 4130.314392 | 4412.354096 | 3775.574468 | 5014.848544 | 3545.540541 |
| H | 2287.869565 | 1845.658120 | 2649.067434 | 3775.576199 | 4713.943327 | 5027.035620 | 6084.141667 | 4461.403727 |
| I | 1994.937063 | 2034.861972 | 2968.232877 | 4632.805411 | 5690.505560 | 5345.414909 | 7002.649123 | 4302.184783 |
| J | 3363.882353 | 4034.175676 | 5142.396947 | 4884.461255 | 5311.789041 | 5186.048000 | 6520.958246 | 4993.571429 |
The best color and best clarity diamonds have an average price that is significantly higher than the rest of the variables. Beyond this observation we begin to see that average price are among the highest with SI2 diamonds.
color_clarity_ct = df_diamonds.pivot_table('carat', index='color', columns='clarity')
heading_properties = [('font-size', '13px')]
cell_properties = [('font-size', '13px')]
dfstyle = [dict(selector="th", props=heading_properties),\
dict(selector="td", props=cell_properties)]
cut_clarity_ct.style.set_table_styles(dfstyle)
| clarity | IF | VVS1 | VVS2 | VS1 | VS2 | SI1 | SI2 | I1 |
|---|---|---|---|---|---|---|---|---|
| cut | ||||||||
| Ideal | 0.455041 | 0.495960 | 0.586213 | 0.674453 | 0.670213 | 0.801575 | 1.007901 | 1.222671 |
| Premium | 0.603478 | 0.533740 | 0.654724 | 0.793308 | 0.833421 | 0.907865 | 1.143252 | 1.289212 |
| Very Good | 0.618769 | 0.494588 | 0.566389 | 0.733683 | 0.811108 | 0.845978 | 1.064338 | 1.281905 |
| Good | 0.616338 | 0.502312 | 0.614930 | 0.757685 | 0.850787 | 0.830397 | 1.034193 | 1.199895 |
| Fair | 0.474444 | 0.664706 | 0.691594 | 0.878284 | 0.887791 | 0.962395 | 1.204688 | 1.345048 |
The trend continues with the increase of carat size from best to worst diamonds. Except when compared with the best color and the best clarity diamonds, the carat size among the best clarity (IF) diamonds are almost equal to the highest carat across the color diamonds. In other words, the best color (D) diamond is only a fraction less than the largest diamond among the best clarity (IF) category.
Visualization
Barplots
Barplot of cut
%matplotlib inline
sns.set_theme(rc = {'figure.figsize':(10,6)})
ax = sns.barplot(x="cut",
y="price",
data=df_diamonds,
palette="Blues_d",
capsize=.2)
Barplot of color
%matplotlib inline
sns.set_theme(rc = {'figure.figsize':(10,6)})
ax = sns.barplot(x="color",
y="price",
data=df_diamonds,
palette="Blues_d",
capsize=.2)
Barplot of clarity
%matplotlib inline
sns.set_theme(rc = {'figure.figsize':(10,6)})
ax = sns.barplot(x="clarity",
y="price",
data=df_diamonds,
palette="Blues_d",
capsize=.2)
Pairplot
ax = sns.pairplot(df_diamonds,
hue= "cut",
palette = 'viridis')
Historgram
df_diamonds.hist(layout=(3,3), figsize=(15,10))
plt.show()
Histogram carat
Taking a closer look at carat’s distribution.
import plotly.express as px
fig = px.histogram(df_diamonds,
x="carat",
marginal="violin",
color_discrete_sequence=['rgb(115, 185, 238)'],
hover_data=df_diamonds.columns)
fig.show()
Notice that the carat’s are distributed in increments?
Normalizing carat
import plotly.express as px
fig = px.histogram(df_diamonds,
x="carat",
histnorm='probability',
color_discrete_sequence=['rgb(115, 185, 238)']
)
fig.show()
The highest probability of carat’s fall between 0.3 and 1.1
Boxplots
from plotly.subplots import make_subplots
import plotly.graph_objects as go
import plotly.express as px
vars = ['carat', 'depth', 'table', 'price', 'x', 'y', 'z', 'volume']
fig = make_subplots(rows=1, cols=len(vars))
for i, var in enumerate(vars):
fig.add_trace(
go.Box(y=df_diamonds[var],
name=var),
row=1, col=i+1
)
fig.update_traces(showlegend=False)
Boxplot of cut
import plotly.express as px
fig = px.box(data_frame = df_diamonds,
x = 'cut',
y = 'price',
color='cut',
category_orders={"cut": ["Ideal", "Premium", "Very Good", "Good", "Fair"]},
color_discrete_sequence=clr)
fig.update_layout(showlegend=False)
fig.show()
Boxplot of color
import plotly.express as px
fig = px.box(data_frame = df_diamonds,
x = 'color',
y = 'price',
color='color',
category_orders={"color": ["D", "E", "F", "G", "H", "I", "J"]},
color_discrete_sequence=color)
fig.update_layout(showlegend=False)
fig.show()
Boxplot of clarity
import plotly.express as px
fig = px.box(data_frame = df_diamonds,
x = 'clarity',
y = 'price',
color='clarity',
category_orders={"clarity": ["IF", "VVS1", "VVS2", "VS1", "VS2", "SI1", "SI2", "I1"]},
color_discrete_sequence=colors)
fig.update_layout(showlegend=False)
fig.show()
It’s unique that VS1 and VS2 have the same exact inner quartile ranges considering they may be priced thousands of dollars differently.
Ordinal Encoding
Creating a rank system for cut, color, and clarity.
# Cut rank
cut_two = pd.DataFrame(df_diamonds['cut'])
df_diamonds['cut_rk']= cut_two.replace({'cut':{'Ideal' : 1, 'Premium' : 2, 'Very Good' : 3, 'Good' : 4, 'Fair' : 5}})
# Color rank
color_two = pd.DataFrame(df_diamonds['color'])
df_diamonds['color_rk']= color_two.replace({'color':{'D' : 1, 'E' : 2, 'F' : 3, 'G' : 4, 'H' : 5, 'I' : 6, 'J' : 7}})
# Clarity rank
clarity_two = pd.DataFrame(df_diamonds['clarity'])
df_diamonds['clarity_rk']= clarity_two.replace({'clarity':{'IF' : 1, 'VVS1' : 2, 'VVS2' : 3, 'VS1' : 4, 'VS2' : 5, 'SI1' : 6, 'SI2' : 7, 'I1' : 8}})
Examining the Ranks of cut, color, and clarity
from plotly.subplots import make_subplots
import plotly.graph_objects as go
import plotly.express as px
vars = ['cut_rk', 'color_rk', 'clarity_rk']
fig = make_subplots(rows=1, cols=len(vars))
for i, var in enumerate(vars):
fig.add_trace(
go.Box(y=df_diamonds[var],
name=var),
row=1, col=i+1
)
fig.update_layout()
fig.update_traces(showlegend=False)
Correlation Heatmap
import plotly.express as px
import plotly.graph_objects as go
import numpy as np
df_corr = df_diamonds.corr()
fig = go.Figure()
fig.add_trace(
go.Heatmap(
x = df_corr.columns,
y = df_corr.index,
z = np.array(df_corr),
colorscale='Viridis'
)
)
Models
import warnings
from sklearn.exceptions import ConvergenceWarning
warnings.simplefilter("ignore", ConvergenceWarning)
Slicing the data for numeric columns and removing highly correlated x, y, and z.
df = df_diamonds.drop(df_diamonds.columns[[1, 2, 3, 7, 8, 9]], axis=1)
df.head()
| carat | depth | table | price | volume | cut_rk | color_rk | clarity_rk | |
|---|---|---|---|---|---|---|---|---|
| 0 | 0.23 | 61.5 | 55.0 | 326 | 38.20 | 1 | 2 | 7 |
| 1 | 0.21 | 59.8 | 61.0 | 326 | 34.51 | 2 | 2 | 6 |
| 2 | 0.23 | 56.9 | 65.0 | 327 | 38.08 | 4 | 2 | 4 |
| 3 | 0.29 | 62.4 | 58.0 | 334 | 46.72 | 2 | 6 | 5 |
| 4 | 0.31 | 63.3 | 58.0 | 335 | 51.92 | 4 | 7 | 7 |
With price reaching as high as $18,823 and carat as low as 0.21, we will need to scale the features.
from sklearn.preprocessing import StandardScaler
standard_scaler = StandardScaler()
df_diamonds_scaled = pd.DataFrame(standard_scaler.fit_transform(df),
columns=df.columns)
df_scaled = df_diamonds_scaled.head()
heading_properties = [('font-size', '13px')]
cell_properties = [('font-size', '13px')]
dfstyle = [dict(selector="th", props=heading_properties),\
dict(selector="td", props=cell_properties)]
df_scaled.style.set_table_styles(dfstyle)
| carat | depth | table | price | volume | cut_rk | color_rk | clarity_rk | |
|---|---|---|---|---|---|---|---|---|
| 0 | -1.198817 | -0.175700 | -1.105557 | -0.904080 | -1.198845 | -0.981476 | -0.936934 | 1.245681 |
| 1 | -1.241062 | -1.373172 | 1.595652 | -0.904080 | -1.247144 | -0.085459 | -0.936934 | 0.638536 |
| 2 | -1.198817 | -3.415919 | 3.396457 | -0.903829 | -1.200416 | 1.706574 | -0.936934 | -0.575752 |
| 3 | -1.072082 | 0.458256 | 0.245047 | -0.902073 | -1.087325 | -0.085459 | 1.414295 | 0.031392 |
| 4 | -1.029837 | 1.092211 | 0.245047 | -0.901822 | -1.019261 | 1.706574 | 2.002102 | 1.245681 |
Linear Regression
from sklearn.linear_model import LinearRegression
from numpy import *
X = df_diamonds[['carat']]
y = df_diamonds['price']
lr = LinearRegression()
lr.fit(X, y)
y_pred = lr.predict(X)
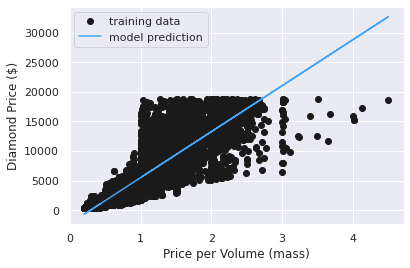
plt.plot(X, y, 'o', color = 'k', label='training data')
plt.plot(X, y_pred, color='#42a5f5ff', label='model prediction')
plt.xlabel('Price per Volume (mass)')
plt.ylabel('Diamond Price ($)')
plt.legend();
from sklearn import metrics
# Using scaled features
X = df_diamonds_scaled[['carat']]
y = df_diamonds_scaled['price']
lr = LinearRegression()
lr.fit(X, y)
y_pred = lr.predict(X)
print("Mean absolute error (MAE):", metrics.mean_absolute_error(y, y_pred))
print("Mean squared error (MSE):", metrics.mean_squared_error(y, y_pred))
print("Root Mean squared error (RMSE):", np.sqrt(metrics.mean_squared_error(y, y_pred)))
print("R^2:", metrics.r2_score(y, y_pred))
Mean absolute error (MAE): 0.252631690580942
Mean squared error (MSE): 0.15029971977032106
Root Mean squared error (RMSE): 0.3876850780857074
R^2: 0.8497002802296789
Multiple Linear Regression
features = ['carat', 'depth','table', 'volume', 'cut_rk', 'color_rk', 'clarity_rk']
X = df_diamonds_scaled[features]
y = df_diamonds_scaled['price']
lr_many_features = LinearRegression()
lr_many_features.fit(X, y);
print(('prediction = ' +
'{} +\n'.format(lr_many_features.intercept_) +
' +\n'.join(['{} * {}'.format(n, f) for f, n in zip(features, lr_many_features.coef_)])))
prediction = -1.0455101613761209e-16 +
0.11935791009746087 * carat +
0.0036623212292048457 * depth +
-0.0006422984576671814 * table +
0.9229942229753505 * volume +
-0.03152197675314965 * cut_rk +
-0.1359159833047961 * color_rk +
-0.21507245231196492 * clarity_rk
print('Multiple features linear model R^2 on training data set: {}'.format(lr_many_features.score(X, y)))
Multiple features linear model R^2 on training data set: 0.9059466891034228
Random Forest
from sklearn.model_selection import train_test_split
X_train, X_test, y_train, y_test = train_test_split(X, y, test_size=0.2,random_state=321)
from sklearn.ensemble import RandomForestRegressor
forest = RandomForestRegressor(random_state = random.seed(1234))
model = forest.fit(X_train,y_train)
y_pred = model.predict(X_test)
from sklearn.metrics import mean_squared_error
print("RMSE: {}".format(np.sqrt(mean_squared_error((y_test),(y_pred)))))
print("R2 : {}".format(np.sqrt(metrics.r2_score((y_test),(y_pred)))))
RMSE: 0.13225034160421884
R2 : 0.9911725406670384
import time
start_time = time.time()
importances = forest.feature_importances_
std = np.std([tree.feature_importances_ for tree in forest.estimators_], axis=0)
elapsed_time = time.time() - start_time
print(f"Elapsed time to compute the importances: {elapsed_time:.3f} seconds")
Elapsed time to compute the importances: 0.470 seconds
plt.rcParams["figure.figsize"] = (8,5.5)
feature_names = [f"feature {i}" for i in range(X.shape[1])]
forest_importances = pd.Series(importances, index=feature_names)
fig, ax = plt.subplots()
forest_importances.plot.bar(yerr=std, ax=ax)
ax.set_title("Feature importances using MDI")
ax.set_ylabel("Mean decrease in impurity")
fig.tight_layout()
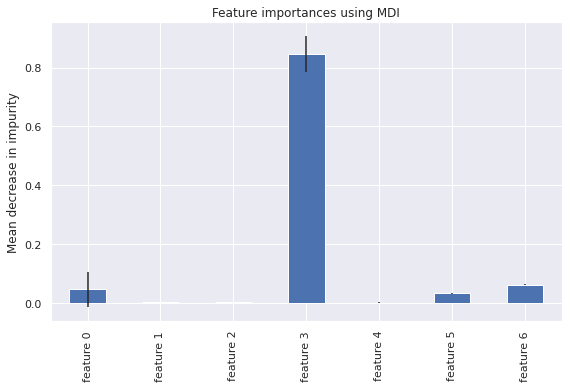
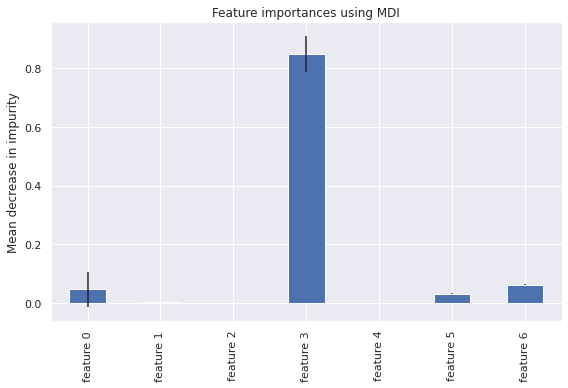
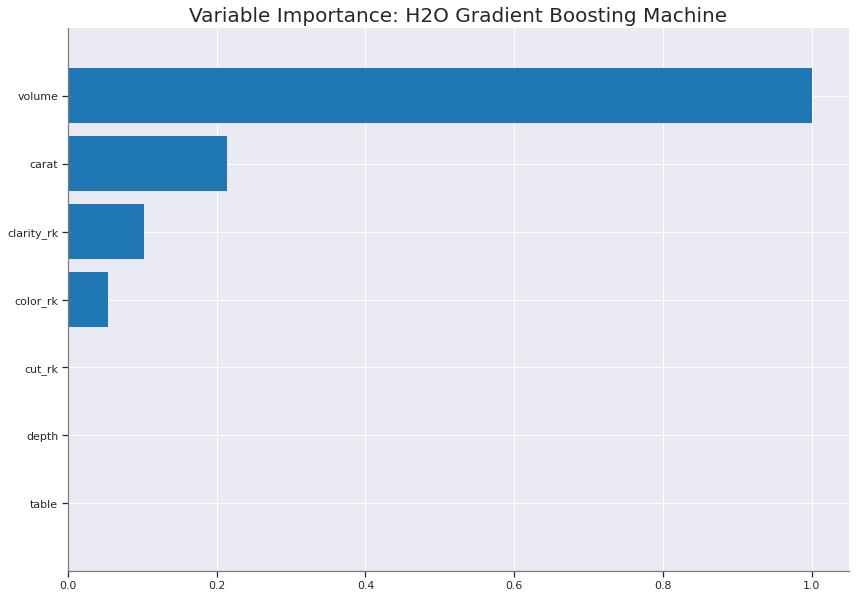
The feature volume appears to the highest importance among the Random Forest model.
from sklearn.inspection import permutation_importance
start_time = time.time()
result = permutation_importance(
forest, X_test, y_test, n_repeats=10, random_state=42, n_jobs=2
)
elapsed_time = time.time() - start_time
print(f"Elapsed time to compute the importances: {elapsed_time:.3f} seconds")
forest_importances = pd.Series(result.importances_mean, index=feature_names)
Elapsed time to compute the importances: 45.103 seconds
fig, ax = plt.subplots()
forest_importances.plot.bar(yerr=result.importances_std, ax=ax)
ax.set_title("Feature importances using permutation on full model")
ax.set_ylabel("Mean accuracy decrease")
fig.tight_layout()
plt.show()
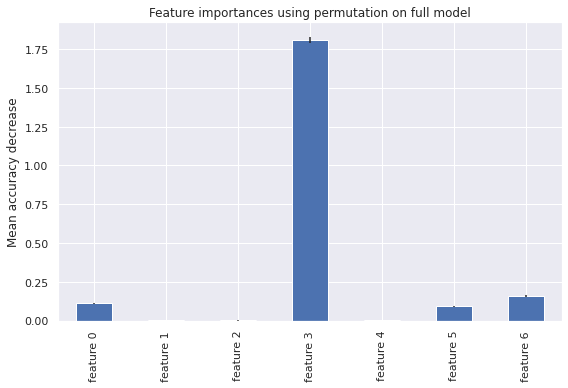
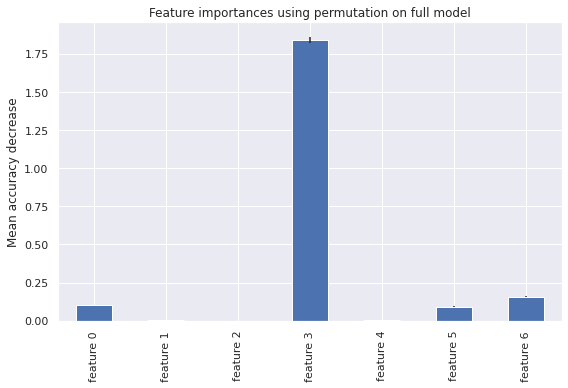
The volume feature remains the highest with permutation feature importance which indicates do not have a bias toward high-cardinality features and can be computed on a left-out test set. This demonstrates the volume overcomes limitations of the impurity-based feature importance.
Hyperparameter Tuning Random Forest
n_estimators = [int(x) for x in np.linspace(10,200,10)]
max_depth = [int(x) for x in np.linspace(10,100,10)]
min_samples_split = [2,3,4,5,10]
min_samples_leaf = [1,2,4,10,15,20]
random_grid = {'n_estimators':n_estimators,'max_depth':max_depth,
'min_samples_split':min_samples_split,'min_samples_leaf':min_samples_leaf}
random_grid
{'max_depth': [10, 20, 30, 40, 50, 60, 70, 80, 90, 100],
'min_samples_leaf': [1, 2, 4, 10, 15, 20],
'min_samples_split': [2, 3, 4, 5, 10],
'n_estimators': [10, 31, 52, 73, 94, 115, 136, 157, 178, 200]}
from sklearn.model_selection import RandomizedSearchCV
from numpy import *
rf = RandomForestRegressor(random_state = random.seed(1234))
rf_random = RandomizedSearchCV(estimator=rf,
param_distributions=random_grid,
cv = 3)
rf_random.fit(X_train,y_train)
y_pred = rf_random.predict(X_test)
print("RMSE: {}".format(np.sqrt(mean_squared_error((y_test),(y_pred)))))
print("R2 : {}".format(np.sqrt(metrics.r2_score((y_test),(y_pred)))))
RMSE: 0.13627217704239236
R2 : 0.9909164510584496
rf_random.best_params_
{'max_depth': 30,
'min_samples_leaf': 2,
'min_samples_split': 3,
'n_estimators': 94}
rf = RandomForestRegressor(max_depth = 30,
min_samples_leaf = 2,
min_samples_split = 3,
n_estimators = 94,
random_state = random.seed(1234))
rf.fit(X_train,y_train)
y_pred = rf.predict(X_test)
print("RMSE: {}".format(np.sqrt(mean_squared_error((y_test),(y_pred)))))
print("R2 : {}".format(np.sqrt(metrics.r2_score((y_test),(y_pred)))))
RMSE: 0.1371532785575916
R2 : 0.9907980602434069
start_time = time.time()
importances = rf.feature_importances_
std = np.std([tree.feature_importances_ for tree in forest.estimators_], axis=0)
elapsed_time = time.time() - start_time
print(f"Elapsed time to compute the importances: {elapsed_time:.3f} seconds")
Elapsed time to compute the importances: 0.269 seconds
feature_names = [f"feature {i}" for i in range(X.shape[1])]
forest_importances = pd.Series(importances, index=feature_names)
fig, ax = plt.subplots()
forest_importances.plot.bar(yerr=std, ax=ax)
ax.set_title("Feature importances using MDI")
ax.set_ylabel("Mean decrease in impurity")
fig.tight_layout()
start_time = time.time()
result = permutation_importance(
rf, X_test, y_test, n_repeats=10, random_state=42, n_jobs=2
)
elapsed_time = time.time() - start_time
print(f"Elapsed time to compute the importances: {elapsed_time:.3f} seconds")
forest_importances = pd.Series(result.importances_mean, index=feature_names)
Elapsed time to compute the importances: 23.421 seconds
fig, ax = plt.subplots()
forest_importances.plot.bar(yerr=result.importances_std, ax=ax)
ax.set_title("Feature importances using permutation on full model")
ax.set_ylabel("Mean accuracy decrease")
fig.tight_layout()
plt.show()
AutoML using H20
import h2o
h2o.init()
Checking whether there is an H2O instance running at http://localhost:54321 ..... not found.
Attempting to start a local H2O server...
Java Version: openjdk version "11.0.15" 2022-04-19; OpenJDK Runtime Environment (build 11.0.15+10-Ubuntu-0ubuntu0.18.04.1); OpenJDK 64-Bit Server VM (build 11.0.15+10-Ubuntu-0ubuntu0.18.04.1, mixed mode)
Starting server from /usr/local/lib/python3.7/dist-packages/h2o/backend/bin/h2o.jar
Ice root: /tmp/tmpcavk4j6w
JVM stdout: /tmp/tmpcavk4j6w/h2o_unknownUser_started_from_python.out
JVM stderr: /tmp/tmpcavk4j6w/h2o_unknownUser_started_from_python.err
Server is running at http://127.0.0.1:54321
Connecting to H2O server at http://127.0.0.1:54321 ... successful.
| H2O_cluster_uptime: | 03 secs |
| H2O_cluster_timezone: | Etc/UTC |
| H2O_data_parsing_timezone: | UTC |
| H2O_cluster_version: | 3.36.1.2 |
| H2O_cluster_version_age: | 1 day |
| H2O_cluster_name: | H2O_from_python_unknownUser_vyy7c7 |
| H2O_cluster_total_nodes: | 1 |
| H2O_cluster_free_memory: | 3.172 Gb |
| H2O_cluster_total_cores: | 2 |
| H2O_cluster_allowed_cores: | 2 |
| H2O_cluster_status: | locked, healthy |
| H2O_connection_url: | http://127.0.0.1:54321 |
| H2O_connection_proxy: | {"http": null, "https": null} |
| H2O_internal_security: | False |
| Python_version: | 3.7.13 final |
diamonds = h2o.import_file("/content/diamonds_new.csv")
Parse progress: |████████████████████████████████████████████████████████████████| (done) 100%
diamonds.describe()
Rows:53902
Cols:14
| carat | cut | color | clarity | depth | table | price | x | y | z | volume | cut_rk | color_rk | clarity_rk | |
|---|---|---|---|---|---|---|---|---|---|---|---|---|---|---|
| type | real | enum | enum | enum | real | real | int | real | real | real | real | int | int | int |
| mins | 0.2 | 50.8 | 49.0 | 326.0 | 3.73 | 3.68 | 2.06 | 31.71 | 1.0 | 1.0 | 1.0 | |||
| mean | 0.7975546361916077 | 61.74943415828728 | 57.45569366628322 | 3930.426793068903 | 5.731397907313265 | 5.733238655337458 | 3.539386850209639 | 129.79038885384568 | 2.0953767949241198 | 3.593948276501803 | 4.948295053986866 | |||
| maxs | 4.5 | 73.6 | 73.0 | 18823.0 | 10.23 | 10.16 | 6.72 | 698.46 | 5.0 | 7.0 | 8.0 | |||
| sigma | 0.47343323947185206 | 1.4196703364355991 | 2.221248682189408 | 3986.8836775360587 | 1.1192018720191774 | 1.111083096761398 | 0.691292416429462 | 76.39956459996696 | 1.1160610424871082 | 1.7012537757016888 | 1.6470707425751165 | |||
| zeros | 0 | 0 | 0 | 0 | 0 | 0 | 0 | 0 | 0 | 0 | 0 | |||
| missing | 0 | 0 | 0 | 0 | 0 | 0 | 0 | 0 | 0 | 0 | 0 | 0 | 0 | 0 |
| 0 | 0.23 | Ideal | E | SI2 | 61.5 | 55.0 | 326.0 | 3.95 | 3.98 | 2.43 | 38.2 | 1.0 | 2.0 | 7.0 |
| 1 | 0.21 | Premium | E | SI1 | 59.8 | 61.0 | 326.0 | 3.89 | 3.84 | 2.31 | 34.51 | 2.0 | 2.0 | 6.0 |
| 2 | 0.23 | Good | E | VS1 | 56.9 | 65.0 | 327.0 | 4.05 | 4.07 | 2.31 | 38.08 | 4.0 | 2.0 | 4.0 |
| 3 | 0.29 | Premium | I | VS2 | 62.4 | 58.0 | 334.0 | 4.2 | 4.23 | 2.63 | 46.72 | 2.0 | 6.0 | 5.0 |
| 4 | 0.31 | Good | J | SI2 | 63.3 | 58.0 | 335.0 | 4.34 | 4.35 | 2.75 | 51.92 | 4.0 | 7.0 | 7.0 |
| 5 | 0.24 | Very Good | J | VVS2 | 62.8 | 57.0 | 336.0 | 3.94 | 3.96 | 2.48 | 38.69 | 3.0 | 7.0 | 3.0 |
| 6 | 0.24 | Very Good | I | VVS1 | 62.3 | 57.0 | 336.0 | 3.95 | 3.98 | 2.47 | 38.83 | 3.0 | 6.0 | 2.0 |
| 7 | 0.26 | Very Good | H | SI1 | 61.9 | 55.0 | 337.0 | 4.07 | 4.11 | 2.53 | 42.32 | 3.0 | 5.0 | 6.0 |
| 8 | 0.22 | Fair | E | VS2 | 65.1 | 61.0 | 337.0 | 3.87 | 3.78 | 2.49 | 36.43 | 5.0 | 2.0 | 5.0 |
| 9 | 0.23 | Very Good | H | VS1 | 59.4 | 61.0 | 338.0 | 4.0 | 4.05 | 2.39 | 38.72 | 3.0 | 5.0 | 4.0 |
diamonds = diamonds[:, ["carat", "depth", "table", "price", "volume", "cut_rk", "color_rk", "clarity_rk"]]
print(diamonds)
| carat | depth | table | price | volume | cut_rk | color_rk | clarity_rk |
|---|---|---|---|---|---|---|---|
| 0.23 | 61.5 | 55 | 326 | 38.2 | 1 | 2 | 7 |
| 0.21 | 59.8 | 61 | 326 | 34.51 | 2 | 2 | 6 |
| 0.23 | 56.9 | 65 | 327 | 38.08 | 4 | 2 | 4 |
| 0.29 | 62.4 | 58 | 334 | 46.72 | 2 | 6 | 5 |
| 0.31 | 63.3 | 58 | 335 | 51.92 | 4 | 7 | 7 |
| 0.24 | 62.8 | 57 | 336 | 38.69 | 3 | 7 | 3 |
| 0.24 | 62.3 | 57 | 336 | 38.83 | 3 | 6 | 2 |
| 0.26 | 61.9 | 55 | 337 | 42.32 | 3 | 5 | 6 |
| 0.22 | 65.1 | 61 | 337 | 36.43 | 5 | 2 | 5 |
| 0.23 | 59.4 | 61 | 338 | 38.72 | 3 | 5 | 4 |
GBM Model
from h2o.estimators.gbm import H2OGradientBoostingEstimator
# set the predictor names and the response column name
predictors = ["carat", "depth", "table", "volume", "cut_rk", "color_rk", "clarity_rk"]
response = "price"
# split into train and validation sets
train, valid = diamonds.split_frame(ratios = [.8], seed = 1234)
# train a GBM model
diamonds_gbm = H2OGradientBoostingEstimator(distribution = "poisson", seed = 1234)
diamonds_gbm.train(x = predictors,
y = response,
training_frame = train,
validation_frame = valid)
# retrieve the model performance
perf = diamonds_gbm.model_performance(valid)
perf
gbm Model Build progress: |██████████████████████████████████████████████████████| (done) 100%
ModelMetricsRegression: gbm
** Reported on test data. **
MSE: 297175.9346014002
RMSE: 545.1384545245365
MAE: 298.17434419493014
RMSLE: 0.12287040514285516
Mean Residual Deviance: -59961.81794308857
print('R^2:', diamonds_gbm.r2())
print('R^2 on validation data:', diamonds_gbm.r2(valid=True))
R^2: 0.9814291623069304
R^2 on validation data: 0.9812236569623808
import matplotlib.pyplot as plt
%matplotlib inline
import warnings
import matplotlib.cbook
warnings.filterwarnings("ignore", category = matplotlib.cbook.mplDeprecation)
diamonds_gbm.varimp_plot();
<Figure size 432x288 with 0 Axes>
AutoML Search
from h2o.automl import H2OAutoML
y = "price"
splits = diamonds.split_frame(ratios = [0.8], seed = 1)
train = splits[0]
test = splits[1]
aml = H2OAutoML(max_runtime_secs = 60, seed = 1, project_name = "diamonds_lb_frame")
aml.train(y = y, training_frame = train, leaderboard_frame = test)
AutoML progress: |███████████████████████████████████████████████████████████████| (done) 100%
Model Details
=============
H2OStackedEnsembleEstimator : Stacked Ensemble
Model Key: StackedEnsemble_BestOfFamily_2_AutoML_1_20220527_213545
No model summary for this model
ModelMetricsRegressionGLM: stackedensemble
** Reported on train data. **
MSE: 163376.48303073455
RMSE: 404.198568813318
MAE: 221.74431915028975
RMSLE: 0.08811328250901963
R^2: 0.9896274225811342
Mean Residual Deviance: 163376.48303073455
Null degrees of freedom: 10063
Residual degrees of freedom: 10060
Null deviance: 158518164125.60925
Residual deviance: 1644220925.2213125
AIC: 149376.76408165455
ModelMetricsRegressionGLM: stackedensemble
** Reported on validation data. **
MSE: 293111.1409579319
RMSE: 541.3973965193514
MAE: 278.7109268472651
RMSLE: 0.10113636742699597
R^2: 0.9823457864836054
Mean Residual Deviance: 293111.1409579319
Null degrees of freedom: 4424
Residual degrees of freedom: 4421
Null deviance: 73479405051.87427
Residual deviance: 1297016798.7388484
AIC: 68270.86509898382
aml2 = H2OAutoML(max_runtime_secs = 60, seed = 1, project_name = "diamonds_full_data")
aml2.train(y = y, training_frame = diamonds)
AutoML progress: |███████████████████████████████████████████████████████████████| (done) 100%
Model Details
=============
H2OStackedEnsembleEstimator : Stacked Ensemble
Model Key: StackedEnsemble_BestOfFamily_3_AutoML_2_20220527_213720
No model summary for this model
ModelMetricsRegressionGLM: stackedensemble
** Reported on train data. **
MSE: 143032.15302056298
RMSE: 378.1959188311833
MAE: 207.24916737663557
RMSLE: 0.08235619094213531
R^2: 0.9910408992276571
Mean Residual Deviance: 143032.15302056298
Null degrees of freedom: 10060
Residual degrees of freedom: 10057
Null deviance: 160625531552.78574
Residual deviance: 1439046491.539884
AIC: 147994.2487763461
ModelMetricsRegressionGLM: stackedensemble
** Reported on validation data. **
MSE: 283749.631509217
RMSE: 532.6815479338636
MAE: 272.7611077737793
RMSLE: 0.09844370443884244
R^2: 0.9828274276559079
Mean Residual Deviance: 283749.631509217
Null degrees of freedom: 5459
Residual degrees of freedom: 5456
Null deviance: 90264416715.4349
Residual deviance: 1549272988.040325
AIC: 84059.73640085015
aml.leaderboard.head()
| model_id | rmse | mse | mae | rmsle | mean_residual_deviance |
|---|---|---|---|---|---|
| StackedEnsemble_BestOfFamily_2_AutoML_1_20220527_213545 | 532.634 | 283699 | 275.046 | 0.100773 | 283699 |
| StackedEnsemble_AllModels_1_AutoML_1_20220527_213545 | 533.505 | 284627 | 273.456 | 0.0994565 | 284627 |
| GBM_2_AutoML_1_20220527_213545 | 537.035 | 288407 | 280.385 | 0.103165 | 288407 |
| GBM_3_AutoML_1_20220527_213545 | 539.86 | 291449 | 277.797 | 0.0996754 | 291449 |
| StackedEnsemble_BestOfFamily_1_AutoML_1_20220527_213545 | 547.002 | 299211 | 278.922 | 0.104543 | 299211 |
| GBM_4_AutoML_1_20220527_213545 | 551.679 | 304349 | 292.328 | 0.119531 | 304349 |
| GBM_1_AutoML_1_20220527_213545 | 556.845 | 310076 | 283.87 | 0.117353 | 310076 |
| XGBoost_1_AutoML_1_20220527_213545 | 567.898 | 322508 | 293.092 | 0.106398 | 322508 |
| DRF_1_AutoML_1_20220527_213545 | 590.945 | 349216 | 303.673 | 0.112203 | 349216 |
| XGBoost_2_AutoML_1_20220527_213545 | 618.187 | 382155 | 345.353 | nan | 382155 |
best_model_aml = h2o.get_model(aml.leaderboard[2,'model_id'])
best_model_aml.varimp_plot();
<Figure size 432x288 with 0 Axes>
print('GBM_2_AutoML_1 R^2:', best_model_aml.r2())
print('GBM_2_AutoML_1 R^2 on validation data:', best_model_aml.r2(valid=True))
XGBoost_1_AutoML_1 R^2: 0.9868201213956783
XGBoost_1_AutoML_1 R^2 on validation data: 0.9822494320805603
aml2.leaderboard.head()
| model_id | rmse | mse | mae | rmsle | mean_residual_deviance |
|---|---|---|---|---|---|
| StackedEnsemble_BestOfFamily_3_AutoML_2_20220527_213720 | 532.682 | 283750 | 272.761 | 0.0984437 | 283750 |
| StackedEnsemble_BestOfFamily_2_AutoML_2_20220527_213720 | 532.682 | 283750 | 272.761 | 0.0984437 | 283750 |
| StackedEnsemble_AllModels_2_AutoML_2_20220527_213720 | 532.766 | 283839 | 270.812 | 0.096823 | 283839 |
| StackedEnsemble_AllModels_1_AutoML_2_20220527_213720 | 532.766 | 283839 | 270.812 | 0.096823 | 283839 |
| GBM_2_AutoML_2_20220527_213720 | 537.9 | 289337 | 278.588 | 0.101383 | 289337 |
| StackedEnsemble_BestOfFamily_1_AutoML_2_20220527_213720 | 542.102 | 293874 | 276.413 | 0.0994625 | 293874 |
| GBM_3_AutoML_2_20220527_213720 | 542.484 | 294289 | 276.929 | 0.0984264 | 294289 |
| GBM_1_AutoML_2_20220527_213720 | 542.522 | 294330 | 279.228 | 0.104282 | 294330 |
| GBM_4_AutoML_2_20220527_213720 | 555.048 | 308078 | 290.994 | 0.114923 | 308078 |
| XGBoost_2_AutoML_2_20220527_213720 | 561.576 | 315368 | 287.206 | 0.101077 | 315368 |
best_model_aml2 = h2o.get_model(aml2.leaderboard[9,'model_id'])
best_model_aml2.varimp_plot();
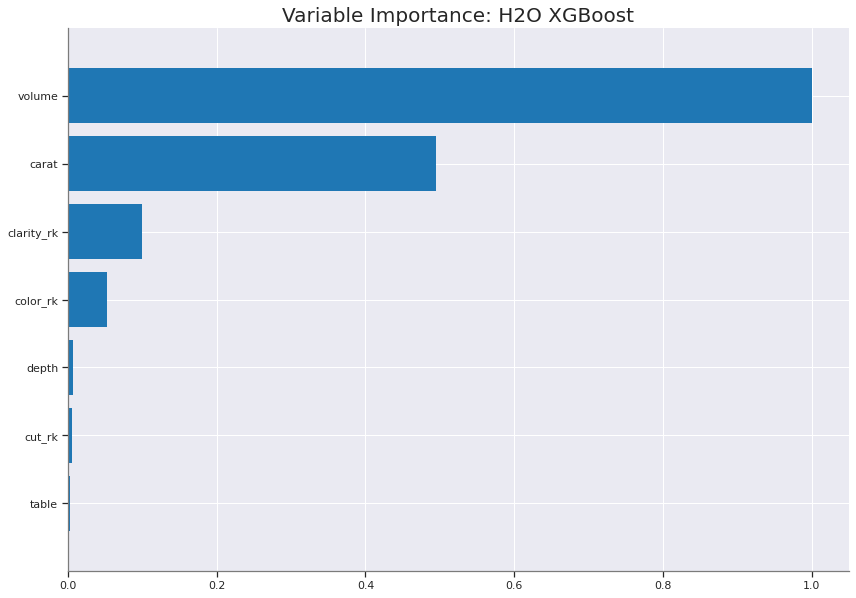
<Figure size 432x288 with 0 Axes>
print('XGBoost_2_AutoML_2 R^2:', best_model_aml2.r2())
print('XGBoost_2_AutoML_2 R^2 on validation data:', best_model_aml2.r2(valid=True))
XGBoost_2_AutoML_2 R^2: 0.9909054467211048
XGBoost_2_AutoML_2 R^2 on validation data: 0.98091389302047
h2o.cluster().shutdown()
H2O session _sid_b971 closed.
Model Results
Model |
r2 |
|---|---|
Linear_Regression |
84.97% |
Multiple_Linear_Regression |
90.59% |
XGBoost_2_AutoML_2 |
98.09% |
GBM_Estimator |
98.12% |
StackedEnsemble_BestOfFamily_2_AutoML_1 |
98.23% |
GBM_2_AutoML_1 |
98.22% |
StackedEnsemble_BestOfFamily_3_AutoML_2 |
98.28% |
Random_Forest |
99.07% |
Conclusion
An analysis was performed using the classic Diamonds dataset, in which the objective was determining the relationship of 4 C’s to price, any identifiable patterns, and how to best price diamonds for brokers.
Through exploration and visualization of the data, observed generalized pattern of inverse pricing accompanied with not normal distributions.
The clearest indication is the combination of best
colorand bestclaritydiamonds are priced significantly higher, whilecut,color,clarityare priced highest from the worst diamonds.Of the 4 C’s
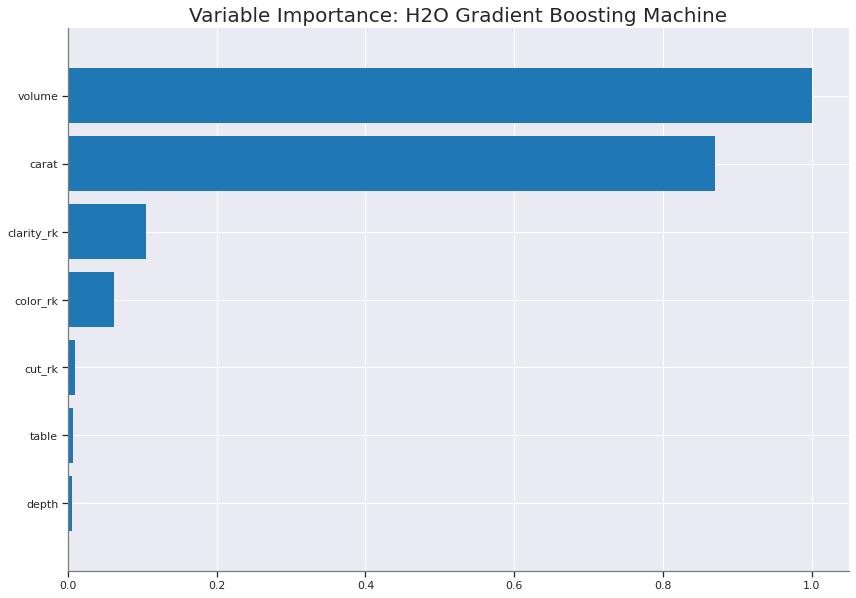
carat’s coefficient level in the multiple linear regression, and among the variable importance compared favorable against the other 4 C’s.After scaling the features, the baseline linear regression captured a modest 84.97% accuracy, while the Random Forest model scored the highest with 99.07%.
The final deliverable was a Tableau Dashboard, to assist brokers with visualizations and a potential pricing mechanism to the
Diamondsdataset. The dashboard can be viewed here